Chart a spreadsheet in Bearly
Bearly does the arithmetic in code, saves the summary as a small spreadsheet, and draws the chart from that file — which stays attached to read and download.
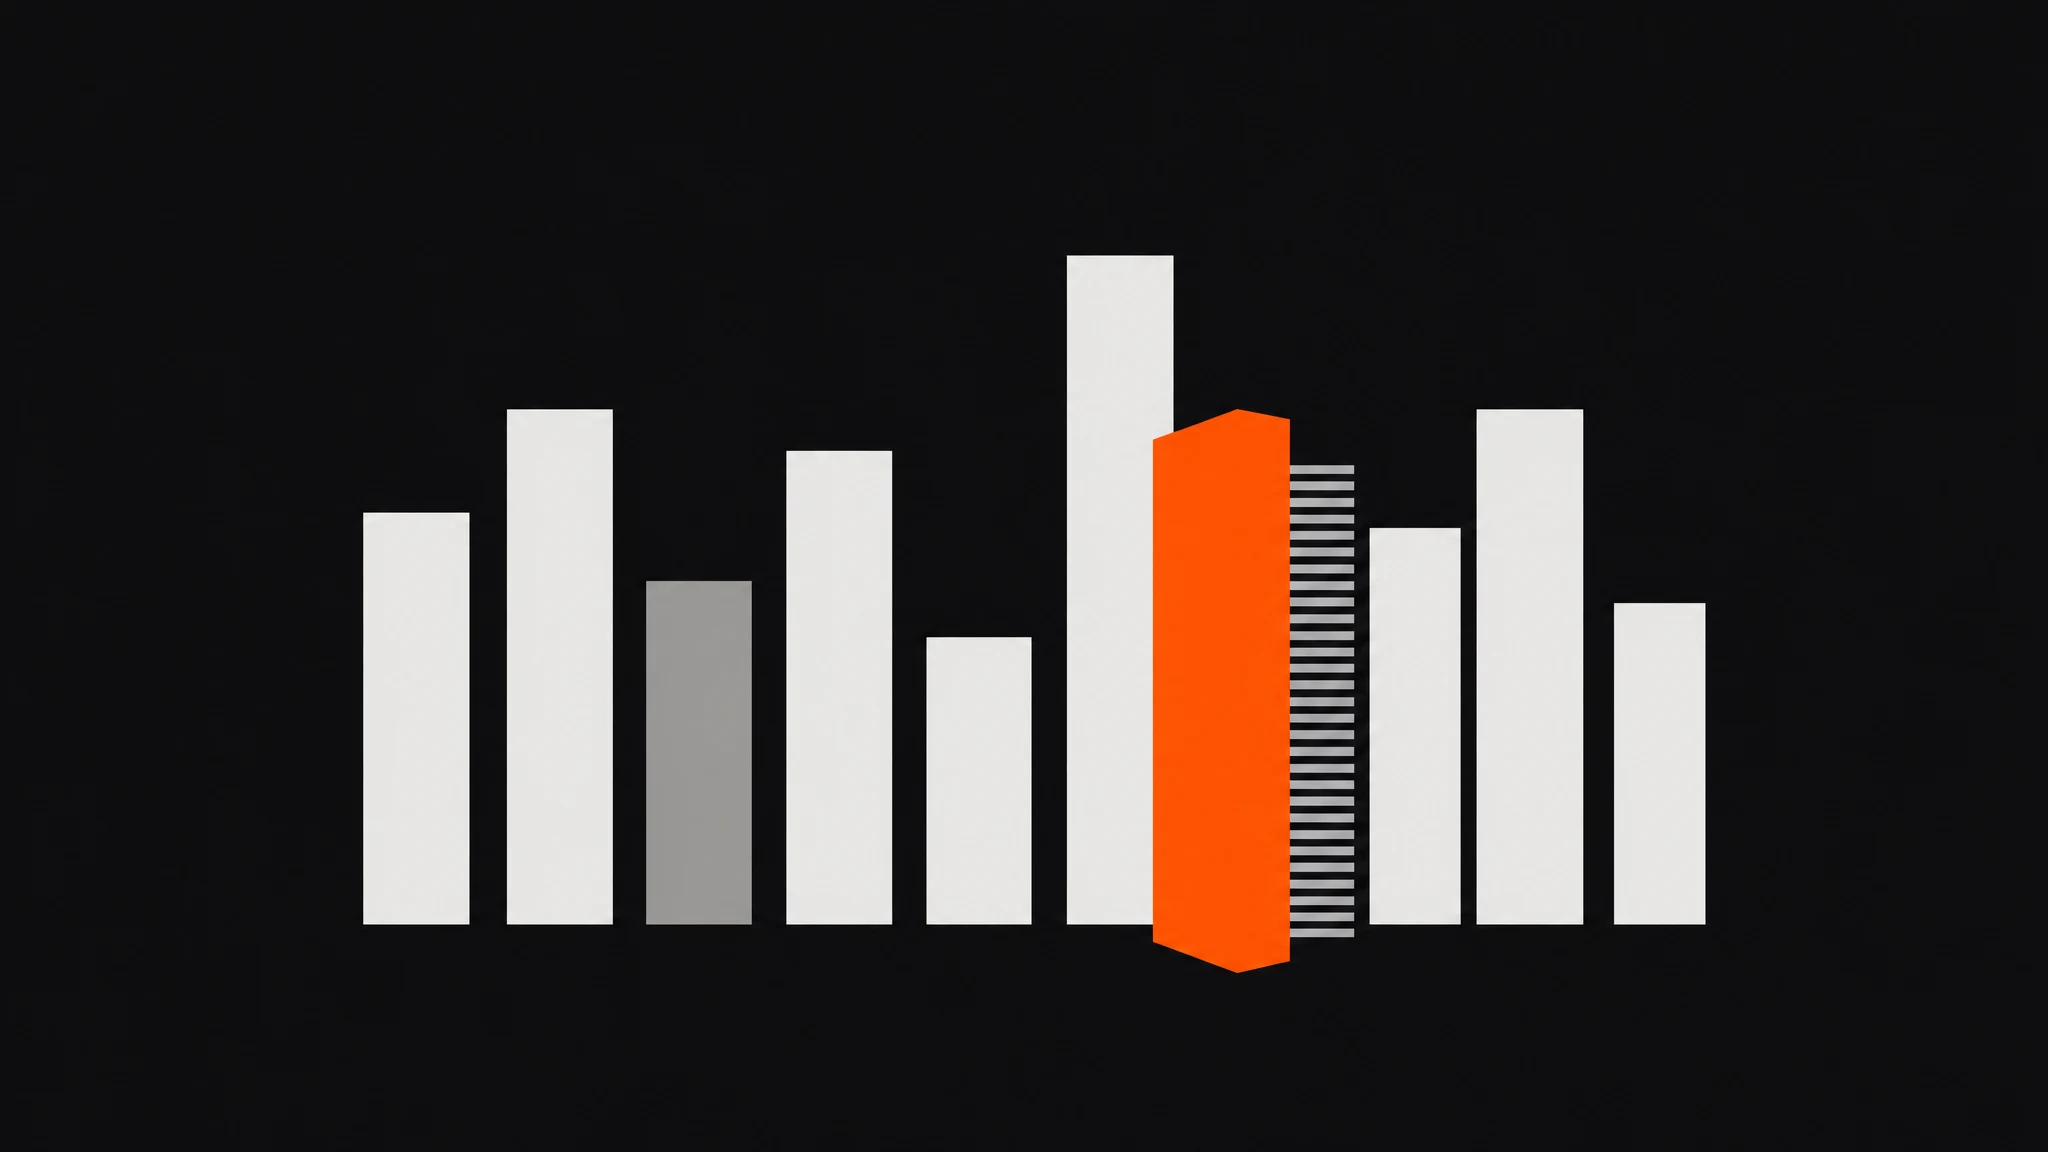
Attach a spreadsheet, say what you want to see, and Bearly draws it: a KPI card, a bar chart, or a line chart in the conversation. Underneath each one is the summarized data it was drawn from, which you can open, read, and download.
The numbers come from a file
The usual way an assistant makes a chart is to read your rows, carry them through its own reasoning, and hand back a picture. Arithmetic done that way can come out wrong, and a picture is the last place you would notice.
Bearly works the other way around. It writes code to do the arithmetic — the grouping, the sums, the month bucketing — and saves the result as a small spreadsheet. The chart is drawn from that file. The model decides what to plot and how to label it; your figures are never retyped along the way.
That summary stays with the chart. View data shows the exact rows it was drawn from. Download CSV takes them with you, and Download PNG gives you the picture for a deck.
A quarter-by-quarter example
Say you have a year of orders: one row per order, with a date, a region, and an amount. Attach it and ask:
Compare quarterly revenue by region.
Bearly groups the orders by quarter and region, sums the revenue, and writes a short summary table — four quarters, a few regions, one number each. Then it draws a grouped bar chart from that table. Moving the pointer anywhere in the plot highlights the nearest bar and shows its value; on a phone, a tap does the same, and the label stays after you lift your finger.
Ask for the same numbers as parts of a whole and you get stacked bars instead. Ask for the trend and you get a line per region. Ask how revenue is tracking against target and you get one number with its goal underneath it.
Tables are still tables
Only three things become charts: a KPI card, a bar chart in single, grouped, or stacked form, and a line chart with one series or several.
Everything else stays a file. Ask for the matching invoices and you get the rows themselves, as a table you can scroll and download — no chart. Same with a pivot: Bearly builds it in code and hands you the table. Ask it to put products on the rows instead and it rebuilds the pivot from your original file rather than rearranging a picture.
Small on purpose
Charts are drawn from summaries, not from raw exports. A bar chart takes up to 100 rows across 30 categories, and a line chart up to 2,000 rows across 12 series. Point Bearly at something bigger and it summarizes first.
The chart step will not quietly sample or truncate to fit. If the summary is still too big, or if it has two rows for the same quarter and region, the chart fails and Bearly rebuilds the summary — it does not add the duplicates together and hope. When a chart cannot be drawn at all, the data view opens in its place with the numbers intact.
Preparing that summary means running code, so it needs either the Python sandbox or, on desktop, permission to work in a local folder. If both are turned off and your file is not already a small, tidy table, Bearly will say so instead of charting.
Availability
Charts is rolling out gradually. It is on for a small number of accounts today and will widen as we see how preparation and rendering hold up against real spreadsheets.
When it reaches your workspace, team admins can control it under Teams → Policies → Media & Creativity → Charts. Turning it off stops new charts from being created. Charts already in your conversations keep working.